
SIEM Graph: Visualizing Security Data for Faster Threat Detection

Forrester expected global cybercrime costs to reach $10.5 trillion annually by 2025. When you ponder over the implications of such a staggering number, a couple of things come to mind. The most obvious and important ones consist of the evolving threats and the urgency of more advanced and capable security solutions to counter them.
Security Information and Event Management (SIEM) systems have long been a staple to help detect and respond to cyber threats. They help large corporations tackle threats and vulnerabilities before they can harm business operations. However, traditional SIEM systems often fall short in visualizing security data with its evolving complexity and diverse nature. Keeping in mind the cybercrime statistic, we must get past these limitations to strengthen our threat detection and incident response.
SIEM graphs have emerged as a promising technology that transforms how we leverage security data. It can consistently deliver faster threat detection and thus decisive incident responses. In this article, we dive into the core concepts, benefits, real-world applications, and challenges of SIEM graphs. We also double down on how PuppyGraph enhances cybersecurity with its cutting-edge graph technology that unifies security data from a broad spectrum of sources for powerful graph analytics.
What is a SIEM Graph
In a traditional SIEM setup, logs and alerts from various sources—firewalls, endpoints, servers, and applications—are collected and correlated using rules or patterns. While this approach centralizes security data, it often remains siloed in rigid structures. Analysts rely heavily on searching and filtering through massive volumes of logs, which can be time-consuming and make it difficult to see the bigger picture.

A SIEM graph, on the other hand, applies graph theory to represent this same data in a more intuitive, interconnected manner. Instead of simply seeing columns and rows of log entries, analysts view nodes (entities such as users, devices, or applications) and edges (the relationships or interactions among them). This network-like view makes it far easier to spot unusual behaviors and understand how individual events link together to form potential attack paths.
You can think of it like a social network—but instead of mapping friendships, you’re revealing hidden relationships among IP addresses, user accounts, files, and other security-relevant artifacts. Under the hood, graph databases excel at managing these complex relationships, allowing analysts to quickly traverse from one suspicious node to a connected event or device. For instance, the graph might highlight if a single compromised account is suddenly accessing an unusual set of resources or communicating with suspicious IP addresses, enabling swift detection and response.
By offering a holistic and visual perspective of security data, SIEM graphs help security teams cut through the noise, reduce false positives, and more effectively protect against threats—often catching malicious activity well before it becomes a critical incident.
The Importance of Visualization in Cybersecurity
With how increasingly complex the threat landscape has become, visualizing security data has become a crucial component in threats countermeasure systems. Traditional security tools often generate massive volumes of raw data. If analysts possess only this raw data, it becomes very difficult for them to identify critical events and patterns. Visualization tools transform this data into digestible formats and simplify them. As a result, you get faster and more effective threat detection.
Humans possess a remarkable ability to process visual information quickly. Our brains recognize patterns and anomalies more easily in visual representations. We can infer information better when we have the ability to explore how the different pieces of it relate to one another. SIEM graphs leverage an innate property that can bring about all these capabilities. It allows security analysts to grasp complex relationships and identify potential threats with greater speed and accuracy.
Imagine trying to investigate a network intrusion by sifting through thousands of log lines. This task becomes significantly easier when you can see a visual representation of the attack path, highlighting the compromised systems and the attacker's actions.
Effective visualization tools also facilitate better collaboration among security teams. A clear visual representation of an attack can help different team members understand the situation quickly for faster and more coordinated incident response. You can minimize the impact of security breaches by fostering such shared understanding.
Key Features and Benefits of SIEM Graphs
Let’s discuss some of the key areas that make SIEM graphs compelling.
Advanced Relationship Mapping
SIEM graphs map relationships between different entities like users, devices, applications, and IP addresses. They represent these entities as nodes and how they relate to one another as edges. Through such interconnected structures, you can easily discover hidden links and dependencies that linear data formats often miss. Analysts can uncover relationships that indicate attack paths or compromised systems.
When you expand a SIEM graph across an entire enterprise, you get an all-inclusive and all-encompassing view into the enterprise’s security data. It becomes an incredibly powerful tool that lets you manage and monitor your company’s security data in real time. Team members gain the ability to comprehend the security details of the products they work on.
Intuitive Visual Interface
SIEM graph services often come with visual interfaces that can enhance complex data analysis and simplify a lot of the pain points associated with abstract data. For example, analysts can explore connections interactively in the UI, zooming in on specific nodes or edges to investigate further, and so on.
Such visualization capabilities can highlight critical attack paths such as the sequence of events in a multi-stage attack. These tools also reduce cognitive load, making it easier for teams to understand and act on security data. The enhanced clarity you get from visualization improves decision-making during high-pressure scenarios.
Real-Time Threat Detection
Graph-based systems can analyze security data streams in real time. By continuously updating nodes and edges, SIEM graphs reflect the latest changes in the environment. This capability helps identify anomalies as they occur, such as unusual network activity or lateral movement. Real-time detection allows security teams to act quickly, minimizing potential damage. The ability to visualize attack paths and identify affected systems reduces the time it takes to contain and remediate threats.
Pattern and Anomaly Detection
SIEM graphs enable deep pattern recognition and anomaly detection. Analysts can identify recurring attack patterns, such as command-and-control communications or privilege escalation chains. Graph algorithms, like clustering or community detection, can dig out unusual groupings of nodes and edges. These insights help predict and prevent future attacks. Detecting anomalies in this manner strengthens overall threat intelligence.
Performance and Scalability
SIEM graphs deliver the high performance needed for real-time security monitoring while scaling effectively with growing volumes of security data. Through optimized graph algorithms and distributed architectures, they can process millions of events and relationships without significant latency, enabling rapid threat detection across large enterprises. The ability to handle complex queries across vast datasets ensures security teams can conduct thorough investigations without performance degradation. Additionally, modern SIEM graph solutions adapt easily to changing data structures, supporting the integration of new data sources and evolving security requirements. This combination of performance and scalability ensures long-term viability in environments with increasing data demands.
Enhanced Collaboration
SIEM graphs foster superior collaboration among security teams by providing a shared visual language for complex security scenarios. Through their intuitive visualization of relationships between security events, assets, and threats, graphs enable team members with different technical backgrounds to quickly grasp the full context of security incidents. This common visual understanding accelerates decision-making during incident response and eliminates communication barriers that often arise when teams rely on raw logs or abstract data. Teams can also annotate graphs to document their investigation findings, creating a rich knowledge base that combines visual context with expert insights. This visual documentation becomes particularly valuable for training new team members and establishing consistent incident response procedures across the organization.
Challenges in Making SIEM Graphs
While SIEM graphs offer powerful capabilities for security analysis, organizations face several key challenges in implementing and maintaining them effectively. Here are the primary challenges.
Data Integration and Quality
The foundation of effective SIEM graphs lies in data quality and integration. Security teams must handle diverse data sources including logs, network traffic, and application telemetry - each with its own format and structure. The challenge intensifies when dealing with inconsistent or incomplete data that requires extensive preprocessing. Organizations must invest significant resources in data cleaning, normalization, and validation to ensure the graph accurately represents security relationships.
Performance at Scale
As security data volumes grow, maintaining graph performance becomes increasingly challenging. Modern enterprises generate billions of security events, translating into massive graphs with complex relationships. The system must efficiently manage queries across these large-scale structures while maintaining response times suitable for real-time threat detection. This requires sophisticated infrastructure and optimization strategies, particularly for features like real-time updates and complex pattern matching.
Visualization and Usability
While graphs excel at showing relationships, they can become overwhelming as they grow in size and complexity. Security analysts must be able to navigate and interpret the visualization without experiencing cognitive overload. The challenge lies in striking the right balance between showing detailed information and maintaining clarity. Teams need intelligent filtering, clustering, and focus+context techniques to make large-scale security graphs manageable and useful.
Technical Expertise Gap
Implementing and maintaining SIEM graphs requires a unique combination of skills spanning graph theory, database management, and security analytics. Many organizations struggle to find or develop talent with this specialized expertise. The learning curve for existing security teams can be steep, particularly when working with graph queries and complex analytical algorithms. This expertise gap can significantly impact the effectiveness of graph-based security solutions.
Operational Integration
Incorporating SIEM graphs into existing security workflows presents both technical and operational challenges. Organizations must ensure seamless integration with current security tools and processes while maintaining operational efficiency. This includes addressing compatibility issues with legacy systems, managing data flow between components, and adapting existing incident response procedures to leverage graph-based insights effectively.
Real-world Applications of SIEM Graphs
SIEM graphs have applications across various cybersecurity domains. Let’s look at some prominent real-world use cases.
Threat Actor Detection and Analysis
SIEM graphs excel at identifying both internal and external threats through behavioral analysis. For insider threats, graphs map relationships between users, accessed resources, and system activities, quickly flagging unusual patterns like mass data access or privilege escalation. In external threat detection, graphs visualize network connections and access patterns to reveal potentially compromised accounts. The ability to analyze temporal patterns helps distinguish between normal business operations and suspicious activities, enabling early intervention before significant damage occurs.
Attack Chain Visualization
SIEM graphs provide comprehensive visibility into attack progression and infrastructure. In malware investigations, graphs reveal infection paths by connecting initial entry points, compromised systems, and command-and-control communications. For phishing campaigns, graphs map relationships between malicious emails, affected users, and subsequent system interactions, helping security teams understand attack scope and impact. This end-to-end visualization allows analysts to quickly identify attack vectors and contain threats effectively.
Advanced Persistent Threat (APT) Detection
SIEM graphs are particularly powerful for uncovering APTs due to their ability to analyze long-term, subtle attack patterns. By aggregating and correlating data over extended periods, graphs can reveal the hallmark characteristics of APT campaigns - from initial compromise to persistent presence and data exfiltration. The temporal analysis capabilities of SIEM graphs help identify slow-moving threats that might otherwise go unnoticed, such as intermittent command-and-control communications or gradual privilege escalation. Graph algorithms can detect subtle indicators like unusual data access patterns or suspicious lateral movement between systems, even when these activities are spread across months. This long-term pattern recognition, combined with the ability to visualize complex attack chains, makes SIEM graphs invaluable for defending against sophisticated state-sponsored or targeted attacks.
Network Security Monitoring
By representing network topology and traffic patterns as interconnected nodes and edges, SIEM graphs enable sophisticated network security analysis. They help detect anomalous traffic patterns, unauthorized access attempts, and potential data exfiltration activities. Graphs can reveal hidden connections between seemingly unrelated network events, making it easier to identify coordinated attacks or lateral movement within the network. This capability is particularly valuable in large-scale networks where traditional monitoring tools might miss subtle attack indicators.
Vulnerability Management
SIEM graphs transform vulnerability management by contextualizing security exposures within the broader infrastructure. They correlate vulnerability data with asset relationships, access patterns, and threat intelligence to prioritize risks effectively. By visualizing how vulnerabilities could be exploited across connected systems, graphs help security teams focus remediation efforts on the most critical issues. This contextual understanding ensures more efficient resource allocation and better risk management decisions.
Incident Investigation and Response
When security incidents occur, SIEM graphs accelerate investigation and response processes by providing clear attack timelines and impact assessment. They help analysts quickly identify affected systems, compromised accounts, and potential data breaches by visualizing the relationships between security events, system activities, and user actions. This comprehensive view enables faster incident containment and more effective recovery strategies, reducing overall incident impact and resolution time.
How Puppygraph can help you with SIEM graphs
PuppyGraph provides a powerful and efficient platform for building and deploying SIEM graphs, empowering your security team to stay ahead of evolving cyber threats. Its unique features and capabilities address the challenges of managing complex security data and enable rapid threat detection and response. Let’s see how!
Real-time, Zero-ETL Graph Analytics - No Graph Database Required
PuppyGraph eliminates the need for Extract, Transform, Load (ETL) processes through its direct-connect architecture, enabling deployment and querying within 10 minutes of installation. While traditional graph solutions require complex ETL pipelines that create static, potentially outdated data snapshots, PuppyGraph takes a different approach.
By establishing direct connections to your existing relational databases, data warehouses, and data lakes, PuppyGraph provides real-time graph analytics on your live security data. This direct connection ensures your security analysis always reflects the current state of your systems, while dramatically reducing deployment time and maintenance overhead. The elimination of ETL processes not only accelerates implementation but also ensures the accuracy and timeliness of your security monitoring.

Data Control and Management
PuppyGraph simplifies security data management while ensuring maximum control over sensitive information. By reusing your existing data store permissions and security infrastructure, PuppyGraph eliminates the complexities typically associated with graph database setup and access control. This approach saves valuable engineering resources while maintaining consistent security policies across your environment.
Your security data remains exclusively within your controlled environment at all times. Unlike traditional graph solutions that require data duplication, PuppyGraph's architecture ensures your sensitive security data never leaves your secure infrastructure. This approach not only strengthens data governance but also simplifies compliance with security regulations and internal policies. With PuppyGraph, you maintain complete control over your security data while benefiting from advanced graph analytics capabilities.
Iterative and Flexible Graph Modeling
PuppyGraph’s design supports iterative and exploratory graph modeling, meaning you can refine models without rebuilding data pipelines. You can create multiple graph model versions for different use cases without rewriting transformations or reloading data. Changes take effect in minutes, enabling rapid experimentation and adaptation. Traditional graph databases can’t match this flexibility, where every model adjustment demands significant engineering effort. PuppyGraph gives you agility and freedom in creating and managing graph models.

Performance and Scalability
PuppyGraph delivers exceptional performance for complex graph queries. Its distributed architecture and optimized query engine enable rapid traversal and analysis of large-scale SIEM graphs. Designed to handle enterprise-scale deployments, PuppyGraph efficiently processes complex multi-hop queries across massive datasets while maintaining consistently fast response times.
The system scales seamlessly to accommodate growing data volumes and evolving security needs. Whether dealing with petabytes of security data, PuppyGraph's auto-sharded, distributed computation ensures consistent performance. This scalability future-proofs your security operations against expanding threats and data growth. Security teams can conduct thorough investigations and threat hunting with speed and efficiency, performing deep, multi-level relationship analysis without worrying about performance degradation.
PuppyGraph is already used by half of the top 20 cybersecurity companies, as well as engineering-driven enterprises like AMD and Coinbase. Whether it’s multi-hop security reasoning, asset intelligence, or deep relationship queries across massive datasets, these teams trust PuppyGraph to replace slow ETL pipelines and complex graph stacks with a simpler, faster architecture.


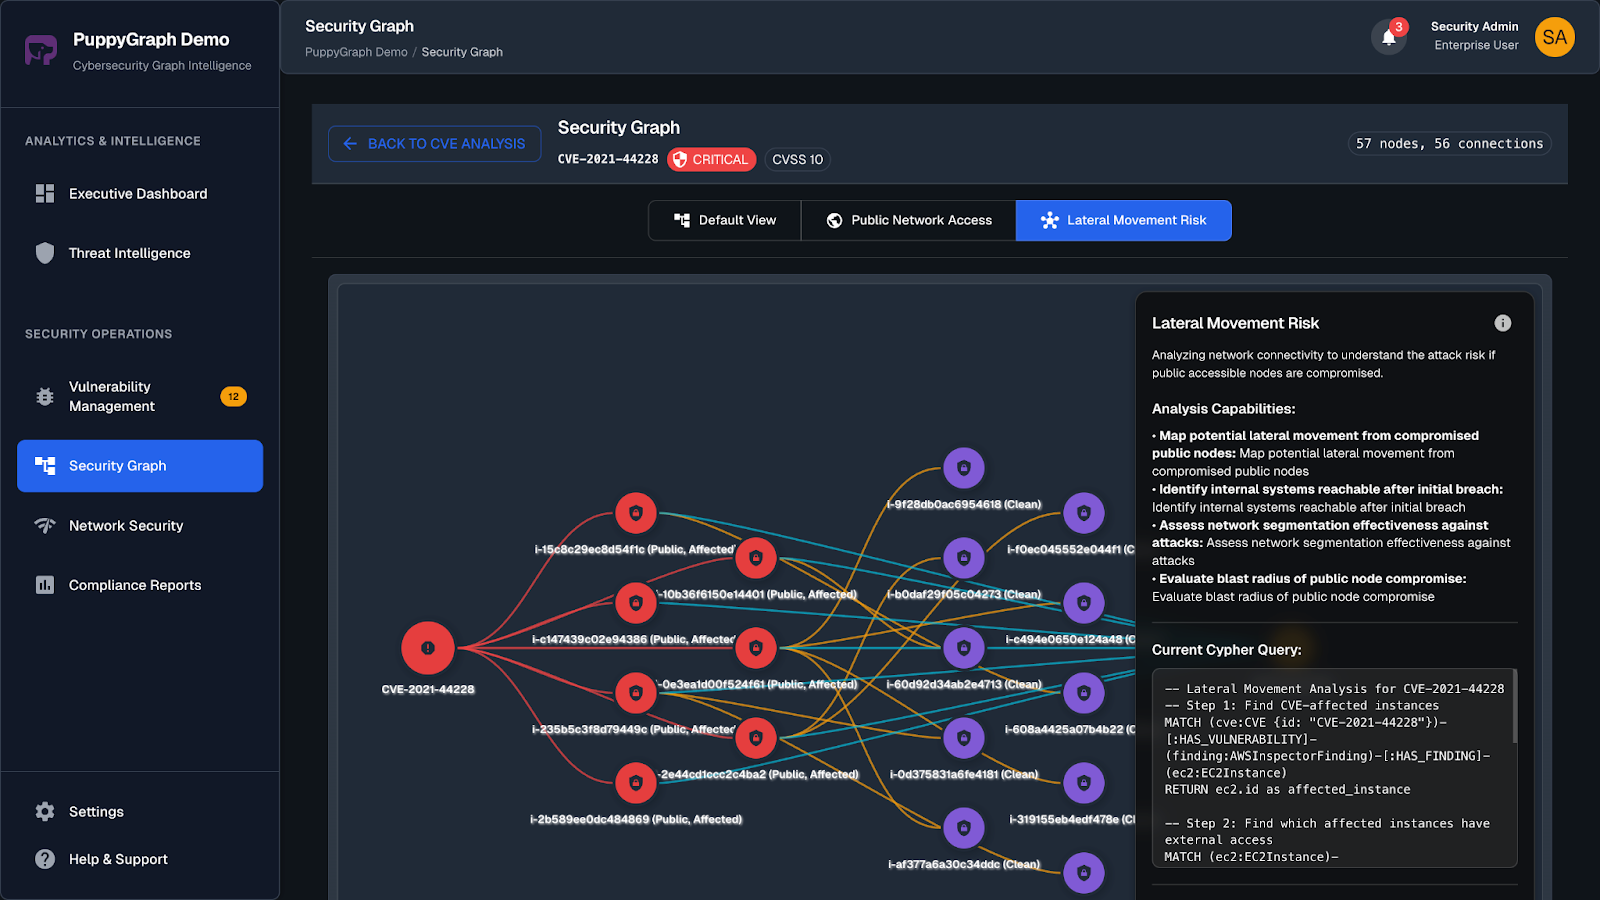
User-friendly Interface and Visualization
PuppyGraph provides an intuitive interface for building, querying, and visualizing SIEM graphs. The Graph Explorer allows you to explore large graphs straight in your browser, even if the graph contains millions of nodes and edges. It dynamically loads more data as you explore through the interface. Additionally, PuppyGraph has a visual query builder that simplifies complex traversals by allowing you to build queries interactively. You can customize the query builder’s UI and how it illustrates different data, resulting in intuitive, meaningful, and compelling graph visualizations that can effectively communicate information.

SIEM graphs are crucial for detecting security threats by visualizing complex relationships and anomalies across systems. Below are three demo videos showcase how PuppyGraph can help cybersecurity companies easily create graph-based approaches that enhance threat detection:
Conclusion
SIEM graphs represent a crucial advancement in cybersecurity, offering powerful capabilities for threat detection and response through their ability to visualize and analyze complex security relationships. While traditionally implementing such systems posed significant challenges, modern approaches have made this technology more accessible and practical. Through its innovative architecture and focus on simplifying graph adoption, PuppyGraph helps organizations harness the full potential of SIEM graphs, providing them with a powerful tool in the ongoing fight against evolving security threats and helping safeguard their valuable assets.
To try PuppyGraph out and see what it can do for you, download the forever free PuppyGraph Developer Edition, or book a free demo today with our graph expert team.

Matt is a developer at heart with a passion for data, software architecture, and writing technical content. In the past, Matt worked at some of the largest finance and insurance companies in Canada before pivoting to working for fast-growing startups.


