
What is an Intelligence Graph? Benefits, Applications

Extracting valuable insights from complex, interconnected data is a significant challenge. Traditional data systems like relational databases excel at static reporting but often struggle when analyzing intricate relationships, such as tracking cyber threats moving across systems or identifying sophisticated fraud networks. Intelligence graphs address this limitation by treating relationships between data points as fundamental elements. This approach transforms data into a dynamic network, enabling deeper analysis and faster detection. This article explains what intelligence graphs are, how they function, and their applications in areas like cybersecurity and analytics. We will also touch upon solutions like PuppyGraph towards the end.
What is an Intelligence Graph?
An intelligence graph is a data structure designed to model entities and the relationships between them to support high-context decision-making. Unlike flat relational models that focus on discrete rows and tables, intelligence graphs treat relationships as fundamental data elements. This shift allows systems to reason about patterns, behaviors, and interactions—not just facts. The model becomes very effective in domains where relationships are the data: cybersecurity, fraud detection, social networks, and knowledge graphs.
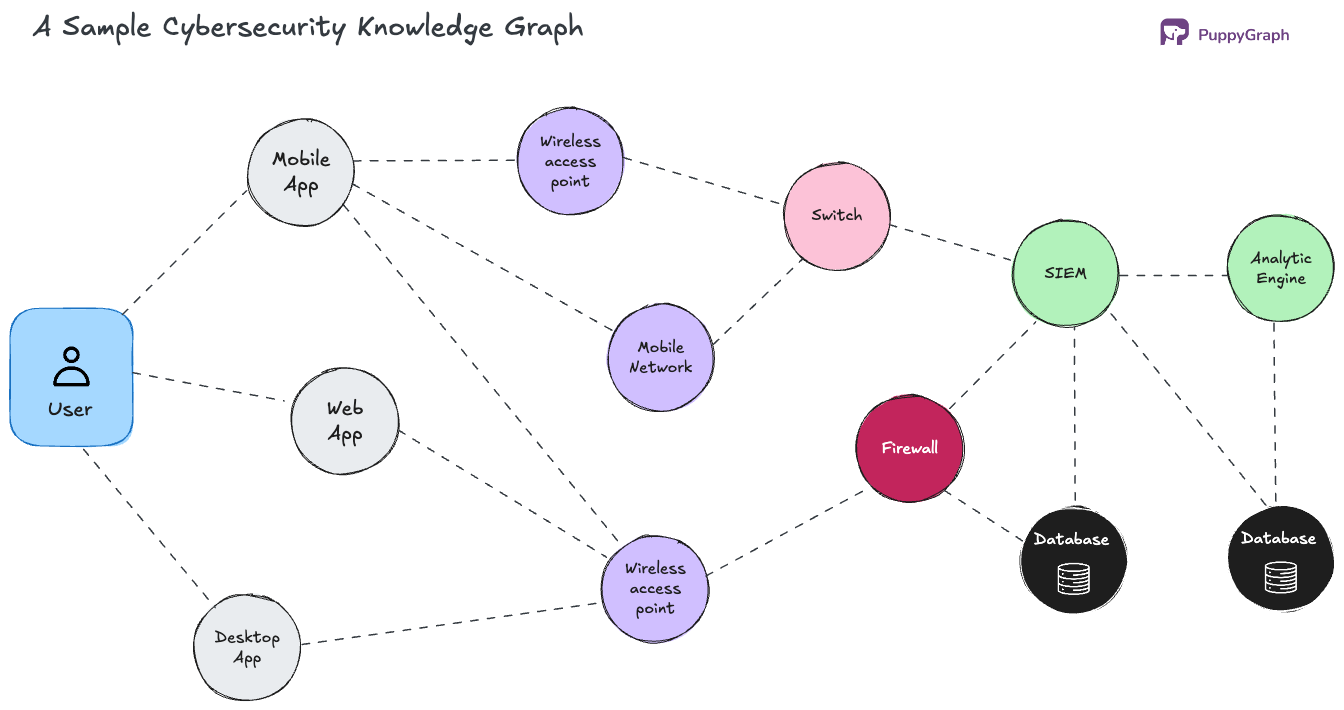
At its core, an intelligence graph consists of mathematical structures called nodes and edges. Nodes represent entities such as users, IP addresses, devices, applications, or alerts. Edges represent the relationships between these nodes, for example 'logged in from', 'connected to', or 'communicated with'. Each node and edge can carry rich properties: timestamps, tags, risk scores, geolocation, or any context relevant to analysis. This flexible structure makes graphs expressive enough to capture real-world complexity without needing rigid schemas.
Intelligence graphs differ from other graph databases or data structures in their purpose. Intelligence graphs don’t just store data in a graph form—they’re optimized for inferring actionable insights. That means supporting operations like graph traversals, path-based querying, pattern recognition, and contextual scoring in near real time.
For example, in a security setting, an intelligence graph can help answer: “Which users accessed sensitive files after logging in from a suspicious IP within the last 24 hours?”. These types of questions are difficult, if not impossible, to answer efficiently in a relational model. Traditional systems are row-oriented and schema-bound. Every relationship you want to represent often requires explicit joins or foreign keys, which quickly becomes brittle at scale.
Intelligence graphs, on the other hand, are relationship-first. You’ll find queries like "show me all systems indirectly connected to a compromised asset" are more direct and efficient to execute, because the data model mirrors the underlying reality of how systems interact. This relational richness is a key advantage of intelligence graphs in modern data analysis. In highly connected environments like networks, enterprises, or user behavior models, insights come not just from what happened, but how things connect with one another. Intelligence graphs collect events as well as contextualize them into a meaningful structure you can reason over.
How Intelligence Graphs Work
Intelligence graphs gain their analytical power from how they enable reasoning, contextual analysis, and real-time exploration of connected data. This involves key aspects of data representation, relationship mapping, and pattern recognition.
Data Representation
Intelligence graphs model data, typically using formats like the labeled property graph (LPG), where both nodes and edges can hold properties, or sometimes RDF-style triples, depending on the system's design. Each node and edge can store various key-value pairs, timestamps, and other contextual metadata. For instance, a user node might have properties like username, role, and last login time, while a 'logged_in_from' edge could store the login time, IP reputation, and geolocation. This allows the graph to capture both structural and semantic meaning. Graph ingestion pipelines are commonly event-driven. Telemetry data, such as security logs (login events, network flows, file access), is often ingested as streaming data and translated into graph updates. Modern graph systems support operations like upserts (updates or inserts) and event deduplication, helping to keep the graph current and queryable in near real-time.
Relationship Mapping
Relationship mapping is fundamental to the value derived from an intelligence graph. It reveals not just which entities exist, but how they are connected over time. Graph edges can be directional (e.g., user → accessed → resource) or bidirectional (e.g., host ↔ peer). They can also include temporal information, enabling time-windowed analysis such as querying, "Which devices connected to the infected host within the last 30 minutes?". This capability to encode and traverse context-rich relationships transforms data exploration. Instead of performing complex joins across tables or relying on precomputed aggregates, graph queries directly follow the edges, even across multiple connections (hops). This makes operations like calculating blast radius in cybersecurity or tracing dependencies in a supply chain computationally feasible for real-time systems.
Pattern Recognition
Intelligence graphs support native pattern matching, an area where they are particularly effective. This allows users to define graph-shaped query patterns—for example, finding "a low-privileged user logging into a high-value asset from a rare location and downloading sensitive files"—and match these patterns against the live graph data. Query languages such as Cypher, GQL, and Gremlin are designed to make these complex pattern queries expressive and readable. Furthermore, many systems enhance this by layering rule engines or machine learning models on top of the graph structure. Anomaly detection algorithms, for instance, can identify unusual deviations in node connection frequency, edge density, or common traversal paths. A user suddenly connecting to ten new systems in five minutes might not stand out in a simple log table, but in a graph representation, such a pattern often becomes clearly visible. Some platforms also utilize advanced techniques like graph embeddings or GNNs (Graph Neural Networks – a type of AI specialized for graph data) to learn latent data representations for tasks like sophisticated threat classification or entity clustering.
Use Cases and Applications
Intelligence graphs enable powerful analysis of complex relationships through their computational and analytical capabilities, often revealing insights difficult or impractical to obtain with other methods. Let’s explore some of the major areas where they are making an impact.
Business Intelligence
Traditional business intelligence (BI) tools are optimized for aggregation and reporting, not for understanding relationships between entities. Intelligence graphs extend BI by revealing the context around those metrics. For example, instead of just showing revenue per customer, a graph can expose how customer behavior spreads through influence networks, support interactions, or how customers tend to use certain products together. This relational layer allows teams to perform impact analysis, root-cause tracing, and opportunity clustering—useful for marketing attribution, upsell targeting, and churn prediction. It turns flat dashboards into navigable models of business dynamics.

Cybersecurity and Threat Detection
In cybersecurity, speed and context encompass almost everything. Intelligence graphs allow analysts to rapidly trace attack paths, lateral movement, and privilege escalation. Instead of manually stitching logs from multiple systems, you can visualize the attacker’s journey: which user logged into which host, accessed what asset, and triggered which alert. By modeling these interactions as a graph, security teams can identify high-risk patterns like credential reuse, peer-to-peer malware spread, or multi-hop access paths to crown-jewel assets. Identifying these complex, multi-step patterns often proves challenging or resource-intensive within traditional SIEMs (security information and event management systems). Intelligence graphs, by modeling relationships explicitly, are well-suited to uncovering these sophisticated threats more directly. Graphs enable security teams to act on connected threats rather than just isolated events.

Fraud Detection and Investigation
Fraud rarely occurs as a solo act—it operates in networks. Intelligence graphs help identify collusion by linking users, transactions, devices, locations, and time patterns. For example, consider a scenario where multiple users apply for loans with overlapping IP addresses, shared phone numbers, or reused documents. The system can link it into a fraud ring—even if each event looks benign on its own. Graph-based fraud detection really shines at identifying hidden relationships that evade rule-based systems. It also allows investigators to explore a visual web of connections, making audits and case reviews more efficient and conclusive.

Social Network Analysis
Social graphs are one of the most mature and widely understood applications of graph intelligence. In this context, intelligence graphs power friend recommendations, influence scoring, group detection, and content personalization. By analyzing the strength, frequency, and type of interactions between users, platforms can rank feed content, detect community clusters, or surface abusive behavior, like coordinated harassment or bot networks. The key benefit is granularity—intelligence graphs can distinguish between a loose connection and a deeply embedded social tie, which directly impacts product decisions and moderation.
Recommendation Systems
Recommendation engines benefit significantly from relationship-aware data models. Intelligence graphs capture not just the user-item interactions, but also patterns across similar users, related items, and how behaviors evolve over time. This structure supports both collaborative and content-based filtering without rigid joins or precomputed matrices. It also makes it easier to build hybrid recommenders—systems that blend real-time graph traversal with ML models. For example, you can use a graph to shortlist candidate items based on structural proximity, which you can then re-rank by leveraging a learning-to-rank model. Through this layered approach, many modern recommendation systems scale relevance with accuracy.
Benefits of implementing intelligence graphs
Intelligence graphs significantly enhance what is possible to achieve with complex, connected data. By modeling relationships as fundamental data elements, they provide faster analysis, deeper insights, and more informed decision-making across complex systems. Let’s discuss some of the most compelling benefits of intelligence graphs.
Enhanced Data Insights
Intelligence graphs surface relationships that traditional systems often miss. Because graphs treat connections as data—not as byproducts of joins—they naturally expose indirect associations, hidden clusters, and emerging behavioral patterns. This makes them particularly effective for exploratory analysis, where analysts don’t always know what they’re looking for upfront. With graph queries, you can easily ask open-ended questions like "what other users exhibit similar access patterns to this suspicious account?" and discover structure in seemingly unstructured data.

Real-Time Contextual Analysis
Graphs are inherently traversal-friendly, which makes real-time reasoning possible even on large datasets. In systems like relational databases, joining across multiple tables to reconstruct context—especially over several hops—is expensive. Intelligence graphs let you execute multi-hop traversals with often lower and more predictable latency compared to complex relational joins, allowing for dynamic investigations, streaming enrichment, or alert triage workflows. In cybersecurity, for example, this gives you real-time impact radius detection, pathfinding to critical assets, or time-bound behavior modeling without pre-aggregation or costly joins. For example, a security team can know how far an infected endpoint could have spread malware in the last 30 minutes with a query like this:
MATCH path = (compromised:Host {id: "host-12"})-[:CONNECTED_TO*1..3]-(h:Host)
WHERE compromised.timestamp >= timestamp() - 1800
RETURN path
A Holistic View of Complex Systems
Modern environments—whether cloud networks, enterprise systems, or social platforms—consist of many interdependent entities. Intelligence graphs offer a structural model that represents this complexity directly, rather than flattening it into rows or trying to simulate it using foreign keys. This makes it easier to reason about cause and effect, system dependencies, or emergent behavior. For example, in a software supply chain audit, the following query finds out which services transitively depend on a vulnerable library libX , reporting each unique dependency depth.
MATCH path = (vuln:Library {name: "libX"})<-[:DEPENDS_ON*]-(app:Service)
RETURN DISTINCT app, length(path) AS dependencyDepth
Improved Decision-Making and Automation
When you possess relationships and context as queryable data, decision-making becomes both faster and more precise. Analysts and engineers can move beyond checklist-based reasoning and instead evaluate threats, opportunities, or failures based on structural evidence. In automated systems, this means you can establish workflows like these:
- Prioritizing incidents based on graph proximity to sensitive assets
- Auto-labeling entities through community detection
- Scoring risk based on the topology of behaviors
These give you better dashboards and work as decision frameworks embedded directly in your data layer.
Challenges and Considerations
Intelligence graphs give you powerful capabilities, but they don’t come without tradeoffs. Building and operating them—especially in dynamic, high-volume environments like cybersecurity—introduces challenges in data integration, performance, and security. Let’s try to understand these friction points. If you’re aware of them early on, you can prevent architectures that are difficult to evolve and help teams design for scale from the start.
Data Integration at Scale
One of the biggest hurdles in building intelligence graphs is integrating heterogeneous data sources into a unified, connected model. If you look at cybersecurity environments, for instance, they produce telemetry from numerous sources—endpoints, identity providers, firewalls, cloud APIs, and third-party threat feeds. They all possess different schemas, formats, and event semantics. Mapping these into a consistent graph structure requires not only normalization, but relationship inference across disparate logs. Building that logic is difficult and can be hard to maintain and adapt if the system depends on batch ETL or rigid pipelines. Real-time ingestion with adaptive schemas often becomes necessary, especially when the source systems change frequently or are event-driven.
Graph Scalability and Performance
Graphs are powerful, but they also grow quickly. In security use cases, a single day’s worth of logs can produce millions of nodes and tens of millions of edges, especially when modeling user sessions, process trees, or network flows. Many traditional graph engines have been designed for smaller, more static graphs—like product catalogs or social networks. They may struggle with write-heavy workloads, frequent updates, or query latency under streaming conditions. Scaling graph workloads means handling not just size, but also time-windowed traversals, path constraints, and high fan-out patterns—like an IP address that connects to hundreds of devices in a short burst.
Privacy and Security Constraints
In domains like cybersecurity and fraud, data is often sensitive by nature—for example, user identities, authentication logs, threat intel, and behavioral analytics. Intelligence graphs, by modeling these relationships in one place, can become high-value targets themselves. This raises challenges in access control, data isolation, and multi-tenant graph security. Additionally, graph structures often reveal indirect information—like lateral movement paths or inferred associations—that traditional RBAC systems aren’t designed to govern. Effective implementations need fine-grained permissions, audit trails for graph queries, and support for partial graph exposure depending on user roles.
Operational Complexity
Maintaining a production-grade intelligence graph often involves stitching together a graph database, ingestion pipeline, schema management, and a separate engine for analytics or ML. This increases operational overhead and introduces failure points between components. Teams often spend more time managing the infrastructure than actually querying or analyzing the graph. If you work in a fast-moving environment like incident response or fraud triage, this complexity becomes a bottleneck—especially if analysts must rely on data engineering teams to make schema changes or deploy updates.
How PuppyGraph can help you
The previous section outlined significant challenges in building and operating intelligence graphs: data integration hurdles, scalability and performance bottlenecks, privacy concerns, and operational complexity. These difficulties often prevent teams from realizing the full potential of graph analytics, especially in demanding, real-time environments.
PuppyGraph is designed specifically to address these challenges. As a real-time, zero-ETL graph query engine, PuppyGraph offers a distinct approach. Instead of requiring complex Extract, Transform, Load (ETL) processes to duplicate data into a separate graph database, PuppyGraph empowers teams to query existing relational data stores directly as a unified graph model. This fundamentally simplifies data integration, bypasses traditional graph database maintenance hurdles, reduces data duplication, and helps maintain a single, consistent dataset across your systems.
This architecture directly tackles operational complexity and latency issues associated with traditional graph setups. By eliminating the need for separate ETL pipelines and graph database management for many use cases, teams can deploy graph analytics much faster – potentially in minutes – and focus more on analysis rather than infrastructure management. PuppyGraph provides lightning-fast data access and query performance directly on source data.
Furthermore, PuppyGraph addresses scalability. It is built to handle large-scale graphs, up to petabyte scale, ensuring quick query responses even with billions of relationships. Its metadata-driven approach, using JSON-based schema files, offers flexibility, allowing multiple analytical perspectives (like IAM relationships or network paths) without altering the underlying source data. This adaptability is crucial in evolving environments like cybersecurity.
For usability, PuppyGraph provides a user-friendly web interface that supports standard graph query languages like openCypher and Gremlin, complete with interactive visualization tools to help analysts effectively explore and understand the complex relationships within their data. By streamlining the difficult aspects of integration, performance, and operations, PuppyGraph makes powerful graph intelligence more accessible and practical.

Conclusion
Modern threats don’t live in silos, and neither should your data. Intelligence graphs offer a powerful way to understand connected systems, expose hidden relationships, and act on context in real time. Whether you’re tracing lateral movement in a breach, surfacing fraud rings, or modeling user behavior across products, graphs turn scattered signals into structured insight.
But building and scaling these systems isn’t trivial. From ingesting noisy telemetry to maintaining low-latency traversals over dynamic data, the technical challenges are real—and they’re why most teams don’t get beyond a prototype.
That’s why we’ve built PuppyGraph to simplify the hard parts: streaming ingestion, scalable graph storage, and real-time querying, all tuned for cyber and behavioral data. If you want to evaluate yourself how PuppyGraph transforms security intelligence, download the forever free PuppyGraph Developer Edition, or book a free demo today with our graph expert team.
Sa Wang is a Software Engineer with exceptional math abilities and strong coding skills. He earned his Bachelor's degree in Computer Science from Fudan University and has been studying Mathematical Logic in the Philosophy Department at Fudan University, expecting to receive his Master's degree in Philosophy in June this year. He and his team won a gold medal in the Jilin regional competition of the China Collegiate Programming Contest and received a first-class award in the Shanghai regional competition of the National Student Math Competition.

Sa Wang is a Software Engineer with exceptional math abilities and strong coding skills. He earned his Bachelor's degree in Computer Science from Fudan University and has been studying Mathematical Logic in the Philosophy Department at Fudan University, expecting to receive his Master's degree in Philosophy in June this year. He and his team won a gold medal in the Jilin regional competition of the China Collegiate Programming Contest and received a first-class award in the Shanghai regional competition of the National Student Math Competition.


Get started with PuppyGraph!


Developer Edition
- Forever free
- Single noded
- Designed for proving your ideas
- Available via Docker install
Enterprise Edition
- 30-day free trial with full features
- Everything in developer edition & enterprise features
- Designed for production
- Available via AWS AMI & Docker install