Graph Algorithms: A Developer's Guide
Graph algorithms address a wide variety of problems by representing entities as nodes and relationships as edges. Want to find the fastest route through a city? Spot influential users on a social media platform? Or detect communities hidden in a sprawling network? Graph algorithms provide the tools to make sense of it all.
In this article, we’ll dive into the world of graph algorithms, breaking them into two broad categories: classical algorithms and data-oriented techniques, exploring high-level concepts for those new to graphs, and the minutia of common algorithms that can be applied against a graph. Let's start by digging into some of the fundamental concepts of graphs.
Introduction to Graphs
Graphs provide a versatile framework for modeling relationships between entities. Whether you’re mapping social connections, optimizing routes, or analyzing web links, graphs offer a powerful way to visualize and solve complex problems that are tougher to solve with more traditional means, such as relational database queries.
What is a Graph?
Definition and Basic Concepts
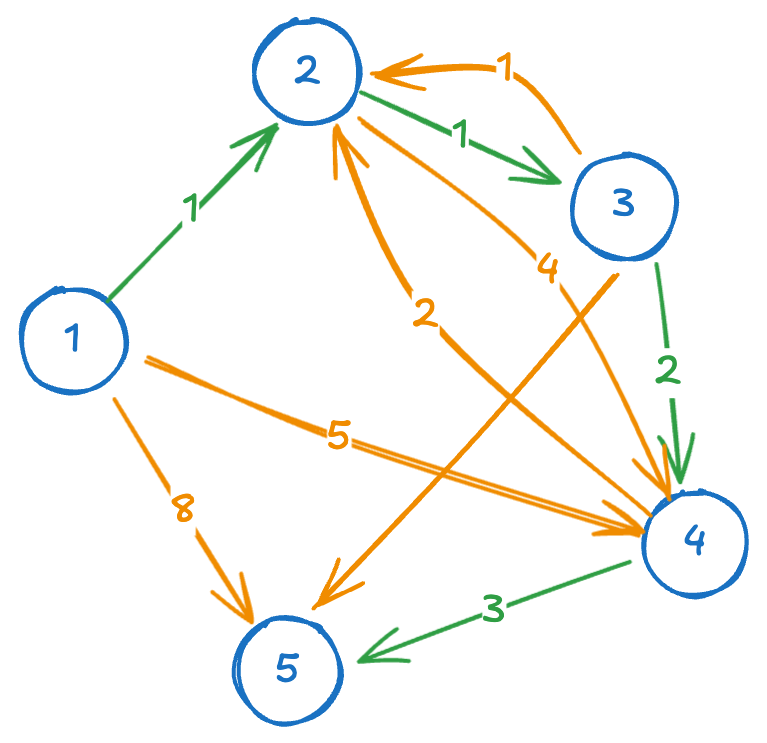
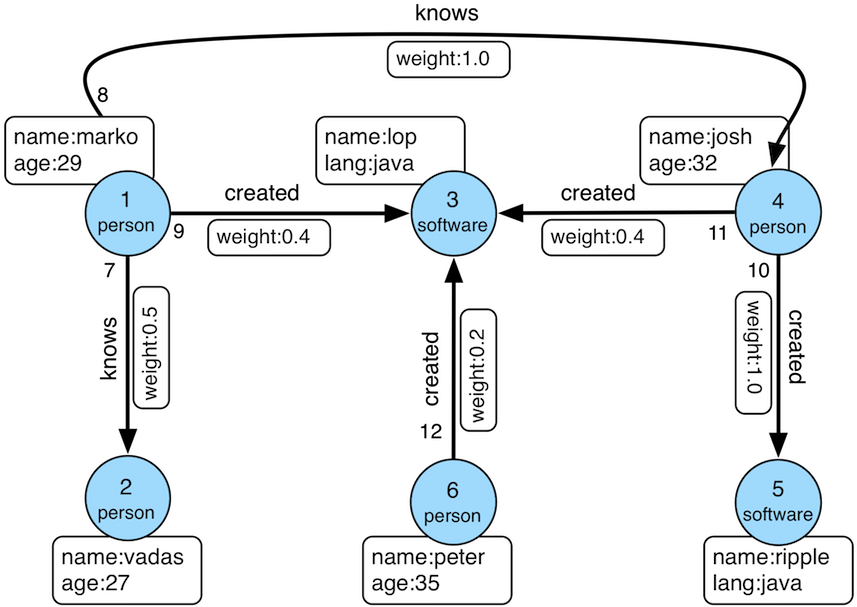
A type of non-linear data structure, a graph consists of nodes and edges. Each node, also called vertices, represents an entity, while each relationship in the graph, represented as an edge, signifies a relationship between two vertices. This fundamental concept in graph theory allows us to model a wide array of real-world scenarios.
Importance in Network Analysis
Graphs are indispensable in network analysis because they easily capture and represent complex relationships. They are used in numerous applications, from social media networks and web page link structures to GPS navigation systems. For instance, in social network analysis, graphs help identify influential users and detect community structures. In web crawlers, they model the connections between web pages, enabling efficient indexing and search. Graphs also play a crucial role in network topology discovery, helping map and optimize communication network layout.
Types of Graphs
Depending on the data and analysis required, graphs can be represented in a few different ways. Each type, or graph class, brings value to different use cases. Let's take a look at some of the most common.
Undirected vs. Directed Graphs
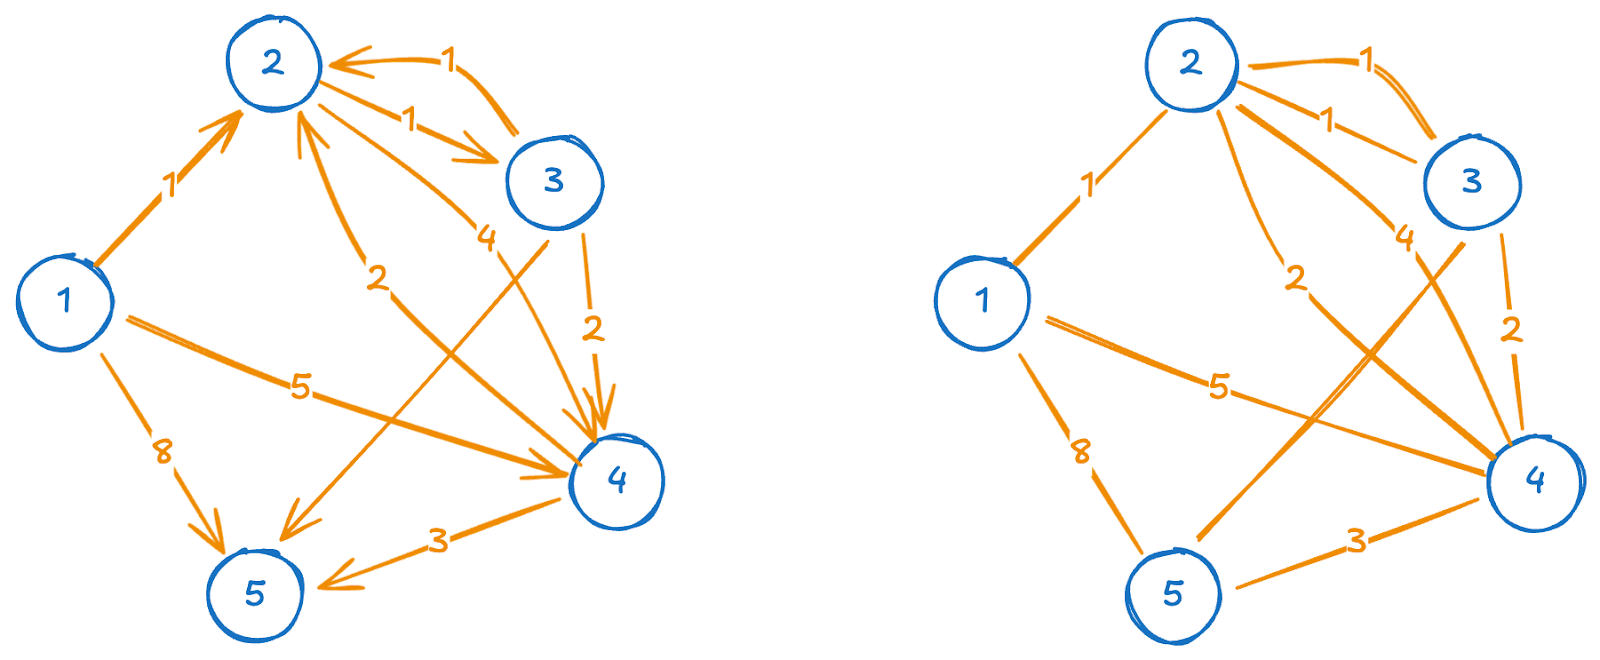
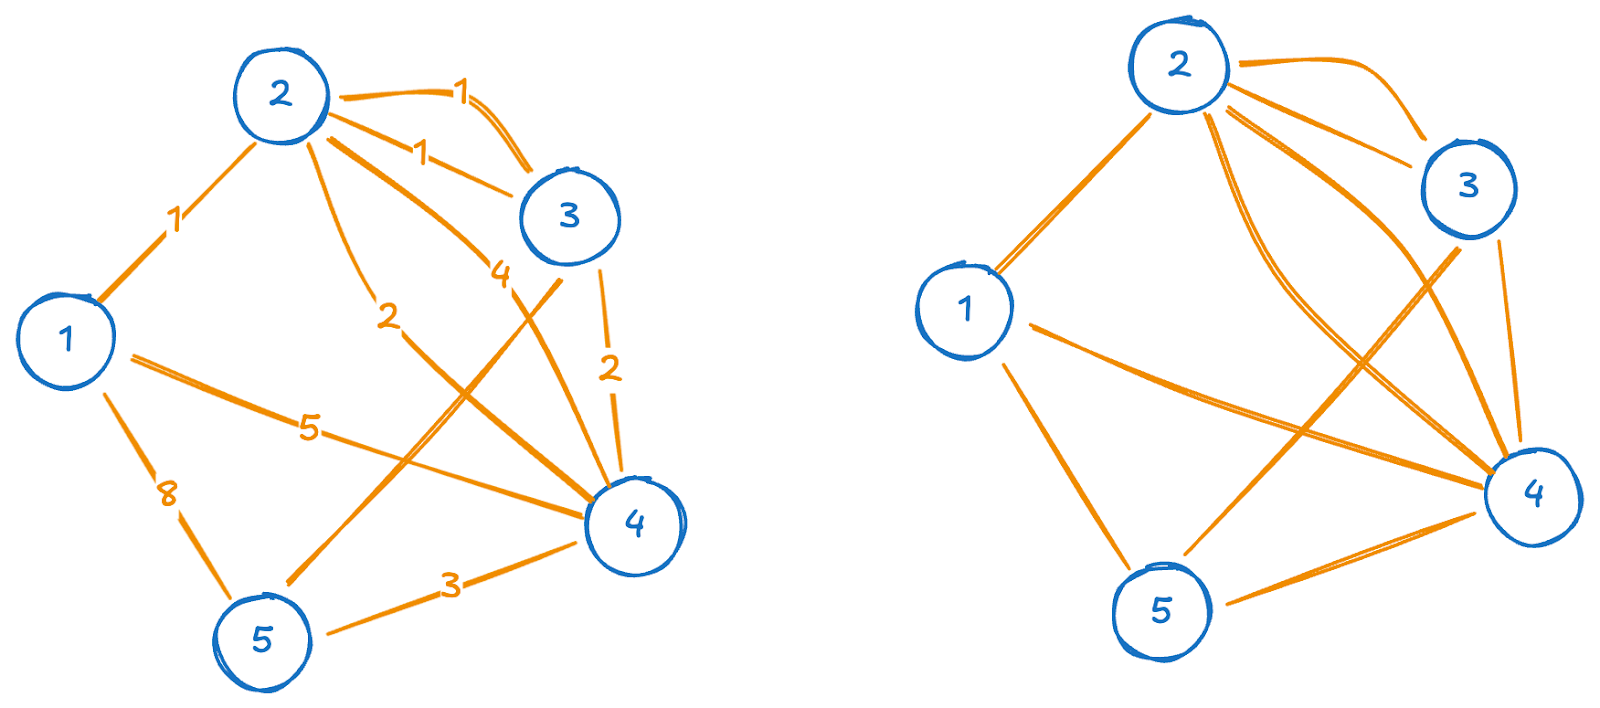
Graphs can be categorized into undirected and directed types. In an undirected graph, edges between adjacent vertices lack direction, signifying mutual relationships between all graph vertices, which is useful for modeling bidirectional scenarios like friendships in social networks.
Conversely, a directed graph has edges with specific directions, indicating one-way relationships between adjacent nodes. They are crucial for representing hierarchical structures or processes with clear flows, such as task scheduling or web page ranking.
Weighted vs. unweighted graphs
Graphs are also classified as weighted or unweighted. In a weighted graph, each edge has a weight or cost, representing factors like distance or time, which is useful in applications like transportation networks. Unweighted graphs treat all edges equally, focusing on the presence or absence of connections.
Labeled vs. unlabeled graphs
Another key distinction lies in whether the vertices (and sometimes edges) are labeled. In a labeled graph, each vertex has a unique identifier, allowing for precise references to specific vertices. This is useful in many real-world applications, such as social networks or web graphs, where each node (e.g., a person or webpage) must be uniquely identifiable. In an unlabeled graph, there is no inherent distinction between vertices, emphasizing the graph’s structure rather than the identities of individual nodes.
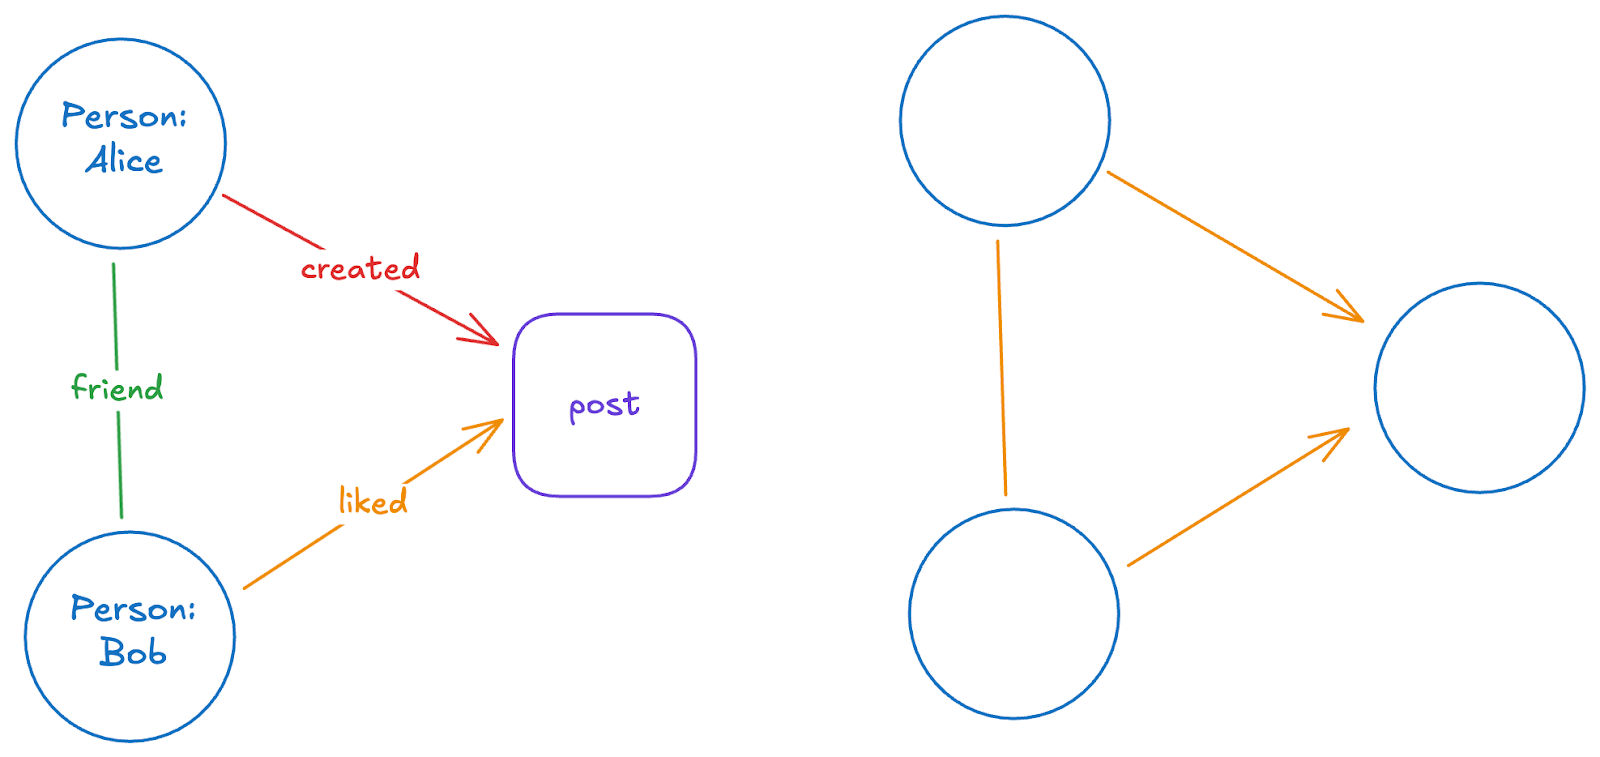
Understanding these graph types—undirected vs. directed, weighted vs. unweighted, and labeled vs. unlabeled—is vital in graph theory for modeling and analyzing complex relationships in fields like computer science, physics, and social sciences. Choosing the right graph type provides deeper insights and practical solutions to various problems.
Classical Graph Algorithms
Classical graph algorithms tackle well-defined tasks, such as finding routes, building trees, or maximizing flow. Each graph algorithm often has formal proofs of correctness and known performance bounds. Here are some primary categories you’ll encounter.
Traversal & Connectivity
Traversal and connectivity form the basis of many graph operations. They help answer fundamental questions such as "Which nodes can reach which other nodes?" and "How do you visit them systematically?"
Key Concepts
- Traversal
- Depth-First Search (DFS): Moves down a path as far as possible before backtracking.
- Breadth-First Search (BFS): Visits nodes in layers, starting from a source and exploring neighbors level by level.
- Connected Components
- Undirected Graph: All nodes reachable from one another form a connected component.
- Directed Graph:
- Strongly Connected Component (SCC): A set of nodes where each node is reachable from every other node in the same set.
- Weakly Connected Component: Nodes that would form a connected component if you replaced all directed edges with undirected edges.
Common Algorithms
Practical Applications
- Cycle Detection: Quickly see if a directed graph has a cycle, which helps in scheduling tasks or verifying consistent dependencies.
- Network Partitioning: Identify disconnected “islands” or subgraphs in social networks, sensor networks, or communication systems.
- Pathfinding: BFS is a go-to for unweighted graphs when you want to discover the minimum number of hops between two nodes.
Traversal and connectivity algorithms often serve as the first step before tackling more specialized tasks. For instance, you might run a DFS to check connectivity before applying shortest-path algorithms on a subgraph or use SCC detection to simplify a complex directed network into a smaller, more manageable representation.
Shortest Paths
Determining a least-cost route underpins many real-world problems, such as finding the fastest way between two cities or minimizing latency in a network. Costs can take different forms—distance, time, or monetary expense. The choice of shortest path algorithm depends on graph structure, edge weights (positive or negative), and whether you need multiple routes or just one.
Key Concepts
- Unweighted vs. Weighted: In unweighted graphs, each edge counts as a single “hop,” while edges have distinct costs in weighted graphs.
- Negative Weights: Some algorithms tolerate edges with negative costs, but detecting negative cycles (loops that continually lower cost) is a separate challenge.
- Single-Source vs. All-Pairs: Some methods find paths from a single origin to all other nodes, whereas others compute distances among every pair. In single-source shortest path algorithms, the source vertex is the starting point from which distances to all other vertices are calculated.
Common Algorithms
Practical Applications
- Transportation & Logistics: Determining optimal delivery routes, minimizing travel times or fuel costs.
- Network Routing: Balancing traffic loads, reducing latency in data transfer paths.
- Game Development: Pathfinding for AI or NPC movement in virtual environments.
Shortest-path algorithms help solve a fundamental optimization problem in numerous domains. Whether edges represent road distances, data transfer speeds, or financial costs, having an efficient way to find minimal routes can lead to faster decisions, lower expenses, and better use of resources.
Minimum Spanning Tree
An MST connects all nodes in a weighted graph with the smallest possible total edge cost without forming any cycles. This concept is central to network design and clustering tasks that involve linking points at minimal expense.
Key Concepts
- Spanning Tree: A subgraph that touches every node but has no cycles, effectively forming a tree.
- Minimum Total Edge Weight: The sum of the edges in the spanning tree is as low as possible.
- Uniqueness: If all edge weights are distinct, the MST is unique. Otherwise, there can be multiple MSTs with the same cost.
Common Algorithms
Practical Applications
- Infrastructure Design: Building cost-effective networks for utilities, transportation, or communication.
- Clustering: MSTs can serve as a backbone for single-linkage clustering, where larger edges can be removed to form clusters.
- Approximate Solutions: MST-based approaches can sometimes form the basis for approximating related problems like the Traveling Salesman Problem (TSP).
MST algorithms help minimize costs in various domains, from laying out a road network with the least total distance to creating an energy grid that reaches all locations at minimal expense. By ensuring no cycles and linking all nodes, these solutions provide a foundational way to efficiently connect items in a weighted graph.
Network Flow
Network flow problems involve sending some “commodity” (such as data, water, or vehicles) from a source to a sink within a network, subject to capacity constraints on the edges. Broadly referred to as a maximum flow algorithm, algorithms in this category aim to maximize flow, detect bottlenecks, or compute minimum cuts that block further movement.
Key Concepts
- Flow: A value assigned to each edge, indicating how much of a resource passes along it.
- Capacity Constraints: Each edge has a maximum allowed flow, known as a maximum flow problem.
- Conservation of Flow: Except for the source and sink, the inflow to a node must equal its outflow.
- Max-Flow Min-Cut Theorem: The maximum flow in a network equals the capacity of the minimum cut that separates the source and sink.
Common Algorithms
Practical Applications
- Resource Allocation: Assign tasks to resources or match jobs to candidates (bipartite matching).
- Traffic and Data Flow Optimization: Manage congestion or data throughput in communication networks.
- Cut Computations: Identify minimum cuts, which may represent weak points or bottlenecks in a system.
Flow algorithms reveal how to move resources from one point to another under constraints, helping planners optimize capacity usage. Whether routing internet traffic or assigning workers to tasks, the max-flow framework provides a rigorous way to find bottlenecks and allocate limited resources effectively.
Directed Acyclic Graphs (DAGs)
A DAG is a directed graph with no cycles. This property allows for an order among all the vertices in the graph, making specific problems more straightforward than in graphs that permit cycles.
Key Concepts
- Acyclic Property: No path loops back to its own starting node.
- Ordering: A DAG can be arranged so that all edges point from earlier to later nodes (topological sorting).
- Dependency Structures: DAGs often represent tasks where an edge indicates a prerequisite relationship.
Common Algorithms
Practical Applications
- Task Scheduling: Plan jobs or projects where specific tasks must be finished before others can begin.
- Data Processing Pipelines: Build systems and continuous integration workflows, where each step depends on the outputs of previous steps.
- Ranking and Ordering: Establish a hierarchy among items that cannot form loops (for instance, specific ranking models in recommendation systems).
DAGs capture scenarios with clear directional flows and no feedback loops. By leveraging their acyclic nature, algorithms become more efficient, enabling straightforward scheduling, sequencing, and dependency tracking.
Data Science–Oriented Graph Algorithms
Algorithms in this category often aim to extract insights or patterns from large networks. They measure centrality, detect communities, or generate vector representations of nodes. Each approach reveals different aspects of a graph’s structure, helping analysts pinpoint influential nodes and group-related entities or embed graph data for machine learning tasks. Understanding these graph algorithms also requires a solid grasp of data structures, which play a fundamental role in implementing these algorithms effectively.
Centrality
Centrality measures help identify “important” or “influential” nodes in a network. Each measure looks at different aspects, from direct connections to overall positioning in the graph. By quantifying node importance, analysts can prioritize resources, detect pivotal points in infrastructure, or spot key influencers in social networks.
Key Concepts
- Node Importance: Each centrality measure uses a specific criterion for how “central” a node is.
- Local vs. Global: Local measures consider a node’s immediate neighbors, while global measures account for paths or entire graph structures.
- Ranking: Centrality assigns numeric scores, making it simpler to compare nodes and rank them by significance.
Common Measures
Practical Applications
- Social Media: Pinpoint users who drive engagement or shape opinions.
- Infrastructure: Recognize nodes that, if disrupted, could fragment the network.
- Biological Systems: Locate proteins or genes that are pivotal in molecular interactions.
Centrality translates the abstract notion of “importance” into quantifiable metrics. This helps decision-makers quickly identify key players or vulnerable spots in complex networks. Whether gauging a website’s rank or spotting weak links in a utility grid, centrality metrics offer practical insights for managing and optimizing interconnected systems.
Community Detection & Clustering
These methods group nodes that are more densely connected than the rest of the graph. They help identify hidden structures, such as social circles or product groupings, by revealing how nodes cluster based on connectivity.
Key Concepts
- Dense Subgroups: A community is a set of nodes that have many internal connections compared to the outside.
- Modularity: A common metric for evaluating how well a graph is partitioned into communities. A higher modularity often indicates more defined group boundaries.
- Overlapping vs. Non-Overlapping: Some methods allow nodes to belong to multiple communities, while others produce partitions with each node in exactly one group.
Common Approaches
Practical Applications
- Social Networks: Identifying circles of friends, interest groups, or market segments.
- Product Clustering: Grouping items with similar purchasing patterns for recommendation engines.
- Biological Networks: Detecting functional modules, such as protein interaction clusters or gene expression groups.
Community detection reveals hidden organization in complex systems, making it possible to understand how nodes group together. This can guide targeted marketing, enable personalized recommendations, or shed light on the underlying structure of everything from social circles to biological pathways.
Graph Embeddings
Embeddings map nodes to a lower-dimensional space, capturing structural relationships in numerical form. This unlocks techniques from traditional machine learning—like clustering, classification, and anomaly detection—since each node becomes a vector that standard algorithms can handle.
Key Concepts
- Dimensionality Reduction: Takes high-dimensional graph data (where each node’s “features” are its connections) and represents it with fewer coordinates.
- Neighborhood Preservation: Good embeddings keep nodes with similar connectivity patterns near each other in the new space.
- Stochastic vs. Analytical: Some methods rely on random walks or neural networks, while others use matrix factorization or projection.
Common Techniques
Practical Applications
- Recommendation Systems: Compute user or item embeddings, then recommend items to users with similar vector representations.
- Link Prediction: Predict future or missing connections in social networks or knowledge graphs by comparing node vectors.
- Graph Clustering & Classification: Treat node vectors as points in a geometric space, applying standard ML techniques to group or label nodes.
Transforming graph data into numerical embeddings makes powerful machine-learning tools available. Instead of dealing with complex adjacency structures, analysts and engineers can use familiar algorithms for clustering, classification, or anomaly detection, all while preserving meaningful relationships from the original graph.
Working with Graph Databases
Storing and querying graph data in a specialized database can streamline the application of graph algorithms. Unlike relational systems, these databases prioritize relationships and traversals, making many graph operations more direct and efficient.
Native Graph Storage
Benefit: Nodes, edges, and properties follow a structure that closely matches the graph model. This reduces the overhead of joins or multiple lookups common in relational schemas.
Implementation Approach: Many platforms store data using a property-graph model or adjacency-based indexing, which can handle large-scale or continuously changing graphs.
Built-In Algorithms
- Idea: Some systems offer ready-to-use procedures for PageRank, shortest paths, or community detection, reducing the need for external libraries.
- Use Cases: Real-time recommendation engines or fraud detection pipelines benefit from the ability to update data and run algorithms within the same system.
Scalability
- Horizontal Sharding: Large graphs may be split across multiple machines.
- Challenge: Keeping queries and traversals efficient can be harder when data is distributed over multiple nodes.
Query Languages
- Cypher, Gremlin, GQL: Specialized languages let you combine graph queries and algorithmic calls without manually coding each step.
Using a graph database, developers can store, query, and analyze interconnected data under one roof. This approach suits applications with frequent, flexible graph operations—such as recommendation systems, social media analytics, or knowledge graphs—by reducing data movement and simplifying the workflow.
Zero-ETL Graph Algorithms With PuppyGraph
Native graph databases are well-suited for OLTP applications due to their row-based storage design. They are optimized for operations like adding, updating, or removing vertices and edges, but they are less efficient for running complex analytical queries on large datasets.
PuppyGraph solves this challenge by enabling users to query relational data as a graph—without the need for ETL processes or a separate graph database. As the first and only graph query engine of its kind, PuppyGraph integrates directly with popular relational data lakes and warehouses. This allows users to perform high-performance analytics while keeping their data in its existing storage systems.
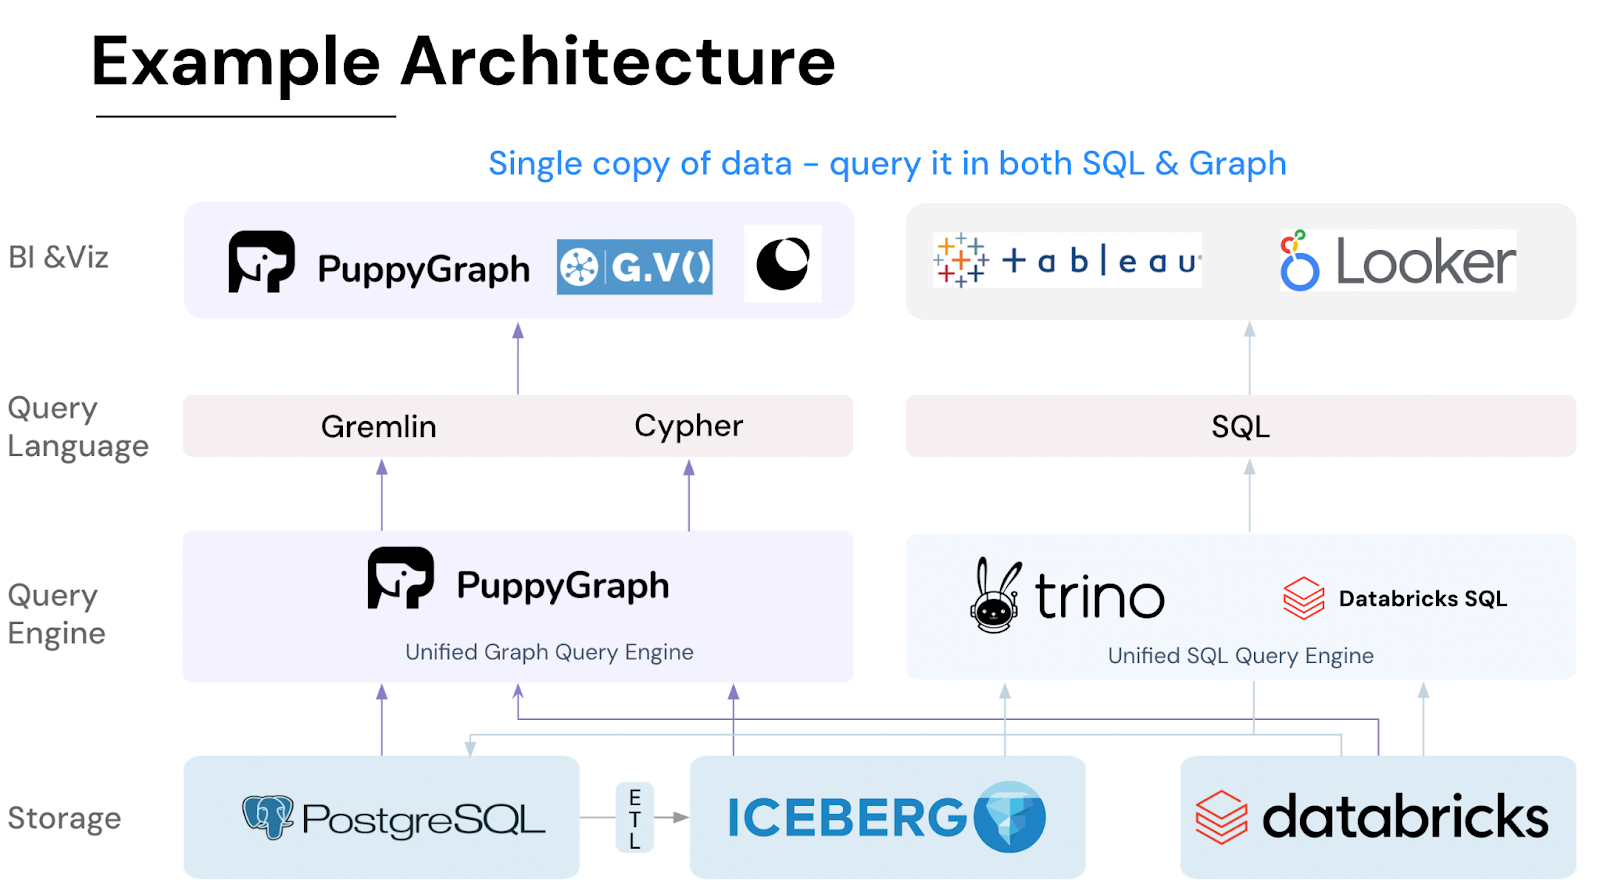
With flexible deployment options—including free Docker containers, AWS AMI, and GCP Marketplace—PuppyGraph supports both self-hosted and cloud environments. Setup is quick and straightforward, taking as little as 10 minutes, which is significantly faster than the setup process for solutions like graph databases.
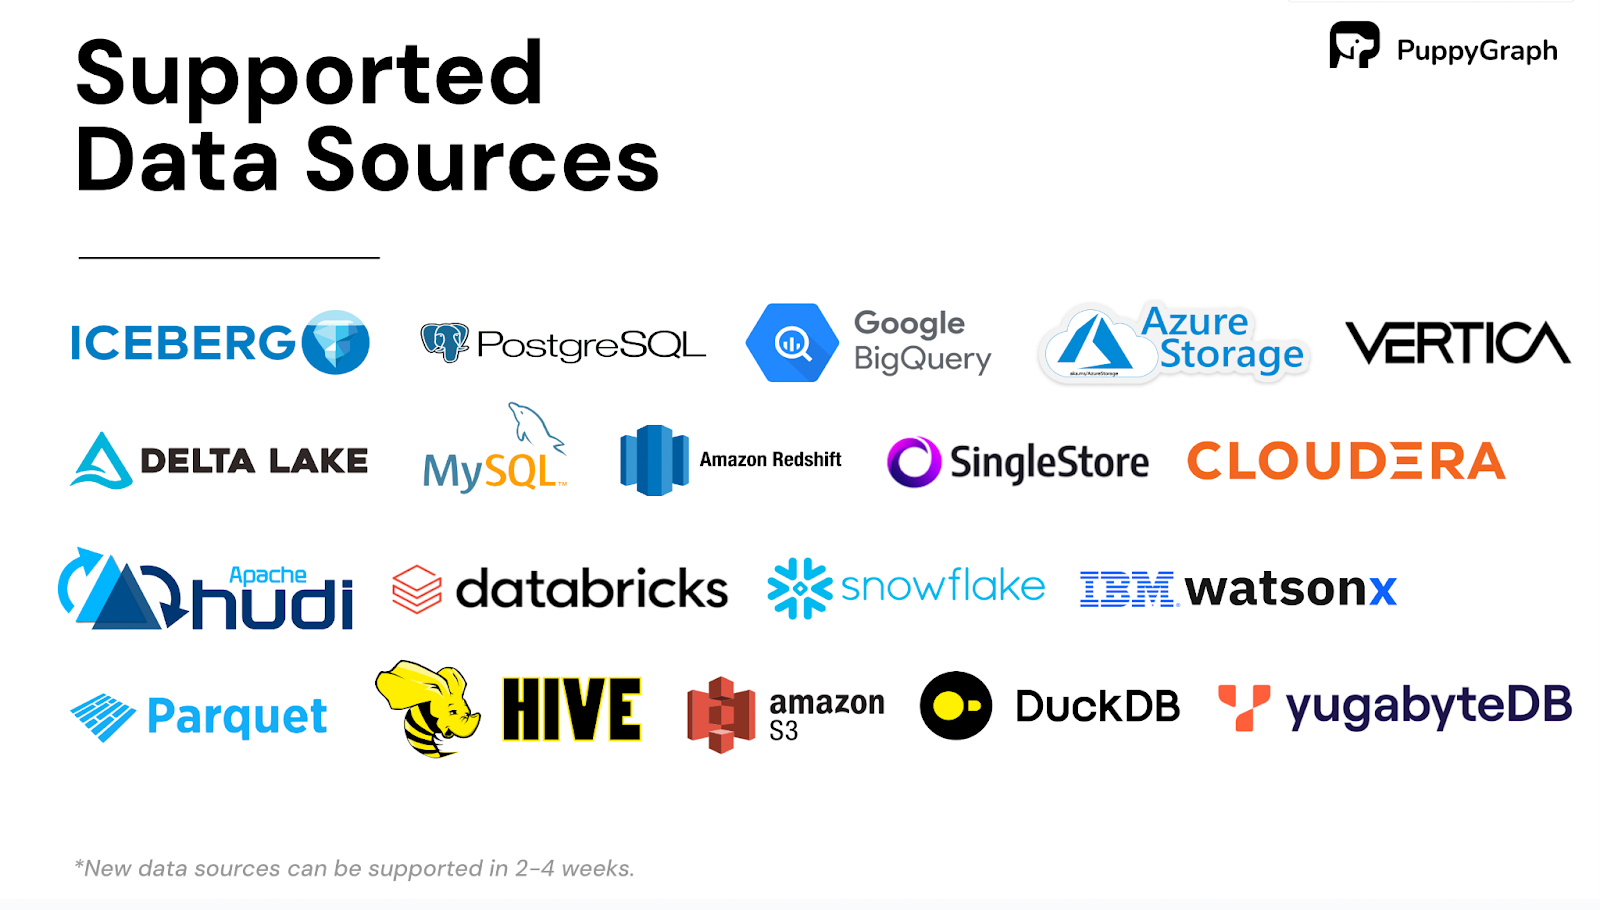
PuppyGraph also excels in integration, supporting direct queries on data sources like Apache Iceberg, Delta Lake, Databricks, Snowflake, AWS Redshift, BigQuery, and SQL databases. Its zero-ETL approach means there’s no need for data migration, allowing users to perform analytics on their existing infrastructure seamlessly.
Additionally, PuppyGraph supports both OpenCypher and Gremlin query languages. It comes with built-in graph algorithms that operate directly on relational data, making it a powerful tool for analyzing complex relationships without disrupting your current workflows.
Conclusion
Graph algorithms provide robust ways to understand and solve problems in any domain where relationships matter. Classical approaches target well-defined tasks, such as finding optimal routes or ensuring connectivity, while data-oriented methods measure and reveal insights about a network’s structure. Together, they cover many use cases—from navigating transportation networks to analyzing social media communities. By examining both algorithm categories and exploring practical aspects like database integration and scalability, you’ve seen how to choose the right approach for different needs. As graphs grow in size and complexity, these algorithms remain essential tools for transforming interconnected data into actionable knowledge.
Interested in trying PuppyGraph? Download the forever free PuppyGraph Developer Edition or start book a demo today with our graph expert team.
Get started with PuppyGraph!
Developer Edition
- Forever free
- Single noded
- Designed for proving your ideas
- Available via Docker install
Enterprise Edition
- 30-day free trial with full features
- Everything in developer edition & enterprise features
- Designed for production
- Available via AWS AMI & Docker install


