
Cybersecurity Knowledge Graph: Smarter Threat Detection

Cyber threats are evolving quickly, and security teams struggle to keep pace. Attackers use automation to carry out phishing campaigns, credential stuffing, and supply chain exploits, while defenders contend with fragmented logs, isolated alerts, and reactive responses. Traditional security tools tend to address individual incidents, which leads to missing the broader patterns that connect malware campaigns, attack infrastructures, and compromised credentials.
This fragmented approach creates a significant gap in threat intelligence. Without a unified perspective, it is nearly impossible to identify the relationships among attack vectors, adversaries, and vulnerabilities in real time. Security analysts often spend considerable time manually reviewing numerous indicators of compromise (IOCs); without effective visualization and correlation, key attack patterns may go undetected. Given the pace at which threats emerge, this method is both inefficient and risky.
Cybersecurity knowledge graphs offer a promising alternative. This article examines how these graphs improve threat detection, reviews their key components and the challenges of constructing them, and explains how PuppyGraph simplifies their implementation, making advanced defense strategies more accessible.
What are Cybersecurity Knowledge Graphs?
Cybersecurity data may quickly become overwhelming if it is not properly managed. Vast amounts of logs, threat intelligence feeds, incident reports, attack patterns, and malware signatures are often stored in separate systems. Traditional security tools frequently struggle to integrate such fragmented data because they store information in isolated silos. Consequently, there is a need for an improved method to integrate and analyze these data, and the answer is provided by cybersecurity knowledge graphs.

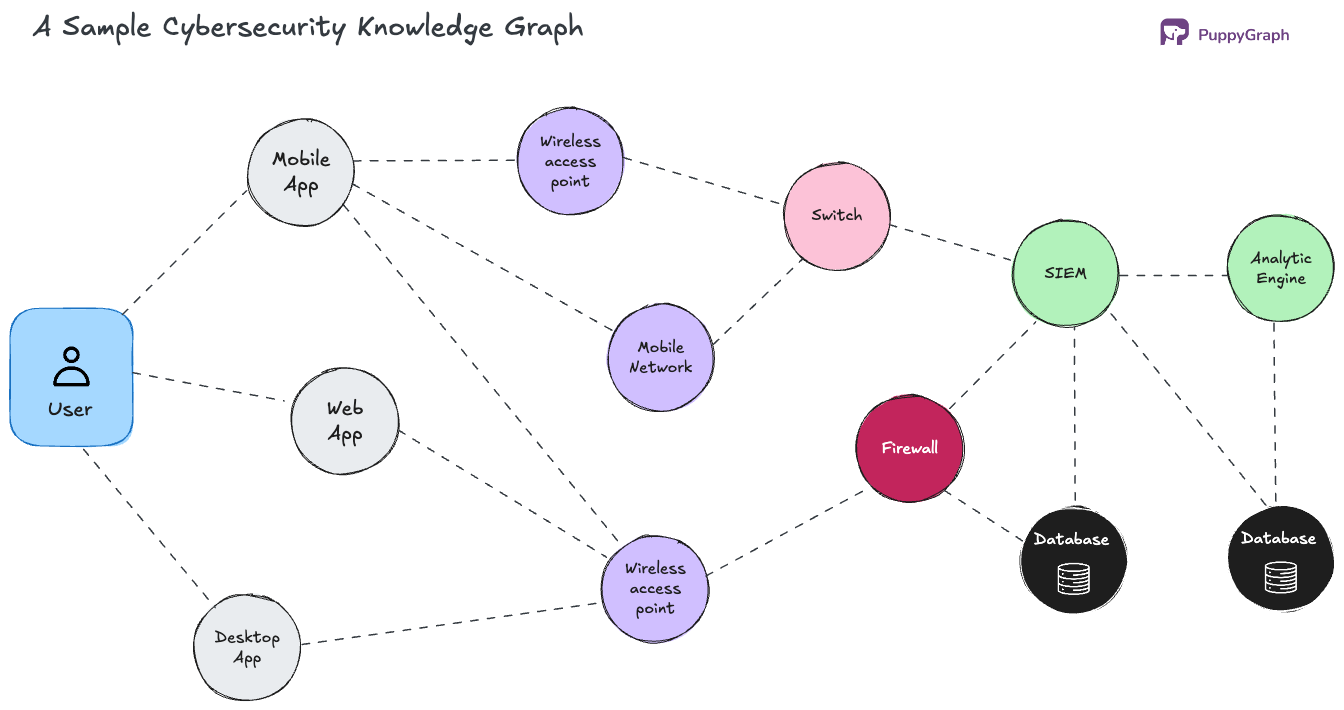
A cybersecurity knowledge graph organizes security data into a structured and interconnected framework. It represents key elements such as cyber threats, adversaries, vulnerabilities, attack tactics and security events.
Unlike traditional databases that store information in flat tables, a knowledge graph models relationships in a manner that reflects the operational techniques of adversaries. It demonstrates how a phishing campaign may lead to the deployment of a malware payload, how a compromised credential may facilitate lateral movement, and how an exploited vulnerability relates to specific attack tactics (TTPs).
How Knowledge Graphs Differ from Traditional Security Databases
Traditional cybersecurity databases employ structured query language, static relationships, and predefined schemas. While these systems are effective for addressing known threats, they often prove inadequate when security teams require the discovery of hidden attack patterns. In contrast, knowledge graphs utilize graph theory to store data as nodes (representing entities) and edges (representing relationships). This approach enables dynamic, flexible, and intuitive queries across complex interconnections. For example:
• In a relational database query one might request, "Show me all IP addresses flagged as malicious."
• In a knowledge graph query one might request, "Show me all IP addresses connected to phishing campaigns that also have links to recognized Advanced Persistent Threat groups."
The first query retrieves isolated data, whereas the second reveals intricate connections among multiple threat indicators, adversaries, and attack strategies.
Components of a Cybersecurity Knowledge Graph
A cybersecurity knowledge graph mirrors how cyber threats actually operate—through relationships. Every compromised IP, malware strain, and adversary tactic has links to one another linked. You can query and analyze them dynamically, unveiling the bigger picture instead of chasing alerts in isolation.
Let’s break down the major components and how the system works.
Nodes: Threat Entities
At its core, a knowledge graph consists of nodes. Each node represents a distinct cybersecurity entity and stores context-rich data that connects attacks, adversaries, and vulnerabilities. The more diverse and well-structured the nodes, the better the graph becomes at detecting patterns among seemingly unrelated threats.
Examples of nodes include:
- Indicators of compromise (IOCs): Malicious domains, command and control servers, IP addresses, and file hashes.
- Threat actors and groups: Advanced persistent threat groups, ransomware groups, and cybercriminal organizations.
- MITRE ATT&CK techniques: Credential dumping, privilege escalation, and lateral movement.
- Exploited vulnerabilities: CVEs tied to real-world exploit kits.
- Infrastructure elements: VPN exit nodes, phishing sites, and dark web marketplaces.
You can think of nodes as the who, what, and where of cyber threats. Each node contains metadata—timestamps, threat confidence scores, geolocation, and forensic details—that analysts can query instantly to understand how threats evolve.
Edges: Relationships Exposing Attack Chains
Edges define the relationships between nodes, providing context for tracking how attacks unfold. These connections reveal patterns in real time by mapping how different elements interact, pivot, or escalate within a network. For example:
- A phishing campaign may distribute malware payloads through compromised websites.
- A zero day vulnerability may be exploited in a supply chain attack.
- A stolen credential may be used for lateral movement across cloud environments.
- A botnet infrastructure may shift command and control servers to evade detection.
This structure enables security teams to trace complete attack paths, identifying not only what occurred but also how threats propagate and what their next steps might be.
Ingestion Pipelines: Feeding the Graph with Continuous Threat Data
The viability of a knowledge graph depends on the quality of data it ingests. Security teams rely on vast volumes of information, and ingestion pipelines ensure that data are continuously updated, structured, and linked to existing threat intelligence. Examples of data sources include:
- SIEM and SOAR logs (e.g., Splunk, Elastic Security)
- Threat intelligence feeds (e.g., AlientVault OTX, MISP)
- Cloud security telemetry (e.g., AWS GuardDuty, Azure Sentinel, Google SCC)
- Dark web monitoring (e.g. leaked credentials, marketplace listings)
- Exploit databases (e.g. CVE records, ExploitDB, proof-of-concept exploits)
Without robust ingestion pipelines, analysts must manually correlate threat reports across multiple tools, making real-time analysis impractical.

Query and Analysis Engine: Extracting Actionable Intelligence
The query and analysis layer allows security teams to investigate attack patterns, track adversaries, and detect emerging threats before they escalate. It supports complex queries such as:
- “Show all malware strains linked to APT28 within the past 90 days.”
- “Trace the infrastructure behind this phishing domain and identify related campaigns.”
- “List all cloud misconfigurations exploited in attacks targeting the financial sector.”
Graph-based queries enable multi-hop analysis, allowing analysts to connect the dots across multiple layers of security data.
Machine Learning and AI-Driven Correlation
Machine learning enhances knowledge graphs by detecting hidden attack patterns, ranking threats by severity, and predicting adversary movements. For example:
- Detecting deviations from normal security behavior.
- Identifying attack patterns before they escalate.
- Uncovering previously unseen relationships in the attack chain.
These techniques shift security from a reactive stance to one that anticipates and neutralizes threats.
Visualization and Graph-Based Threat Mapping
Graph visualization tools provide real-time dashboards that expose hidden relationships among cyber threats, infrastructure, and attack techniques. Such visualizations help in:
- Tracing the evolution of attack groups.
- Visualizing lateral movement across an enterprise.
- Detecting coordinated attack campaigns as they occur.
This visual representation enables security teams to assess the threat landscape quickly and respond effectively.

Enhancing Threat Intelligence with Knowledge Graphs
The effectiveness of threat intelligence depends on the ability to integrate and contextualize vast, disparate data sets. Security teams routinely gather information—IP blacklists, malware hashes, incident reports, threat feeds, and more—from isolated systems. When left unconnected, these data sources obscure critical attack patterns. Knowledge graphs overcome this limitation by linking indicators of compromise (IOCs) into structured, queryable relationships.
For example, a malicious IP address is not treated in isolation; it is automatically associated with related file hashes, domain names, adversary groups, and historical incidents. This unified view enables analysts to quickly grasp the context behind each threat. Unlike traditional systems that rely on static lists and manual correlation, knowledge graphs dynamically map multi-step attack sequences—such as a phishing email leading to credential theft, lateral movement, and data exfiltration—in real time. Moreover, by continuously ingesting new threat data, these graphs support predictive analysis, allowing organizations to identify emerging trends and adjust their defenses proactively. Automation in correlating threat data also reduces manual workload and shortens response times, fostering a more agile security posture.
These advanced capabilities lay the foundation for significant operational improvements, directly translating into a range of tangible benefits for organizations.
Benefits of Using Knowledge Graphs in Cybersecurity
Knowledge graphs overcome key limitations of conventional cybersecurity methods by automatically integrating, analyzing, and visualizing complex threat data. Their advantages include:
Faster Threat Detection
Traditional SIEMs and legacy systems analyze events in isolation, often missing coordinated attack chains hidden in seemingly benign activities. In contrast, knowledge graphs link events from multiple sources in real time. For example, instead of treating a failed login, a PowerShell execution, and an outbound network request as separate alerts, the graph connects them into a unified picture of lateral movement. This multi-hop analysis enables rapid detection and helps teams trace adversary movements across network layers.
Improved Threat Correlation
Threat intelligence feeds often generate disconnected indicators that require manual correlation. A knowledge graph automatically contextualizes new IoCs by linking them to related malware families, attack campaigns, and adversary tactics. For instance, if a new command and control server is detected, the graph immediately reveals its association with previous ransomware or phishing operations, allowing analysts to prioritize high-risk threats and recognize infrastructure reuse patterns.
Stronger Defense Against APTs
Advanced persistent threats unfold over time, evolving from initial access to lateral movement and data exfiltration. Traditional tools struggle to connect these phases. Knowledge graphs build comprehensive profiles of attacker behavior by linking early-stage activities with subsequent attack phases. This holistic view enables security teams to detect and disrupt multi-step attacks before significant damage occurs.
Automated Security Operations and Incident Response
By automating data enrichment, attack path mapping, and response recommendations, knowledge graphs significantly reduce manual investigations. When a compromised IP is detected, the system automatically retrieves related indicators and known tactics, allowing analysts to swiftly block threats, isolate affected systems, and remediate vulnerabilities. This automation dramatically shortens response times, even when handling large data volumes.
Predictive Security
Unlike reactive security tools, knowledge graphs support predictive analysis by uncovering trends such as infrastructure reuse and emerging malware techniques. For example, if a new ransomware campaign leverages a previously known C2 infrastructure, the graph can recognize the pattern—enabling security teams to proactively harden defenses. This predictive capability helps organizations stay ahead of evolving cyber threats.
Challenges in Creating Cybersecurity Knowledge Graphs
Despite the many advantages they offer, building and maintaining cybersecurity knowledge graphs presents significant technical and operational challenges. Without proper implementation, these graphs can become slow, fragmented, and unreliable, undermining their effectiveness in security operations.
Data Ingestion Complexity and Conflicting Intelligence
Security data originates from diverse sources—SIEM logs, threat intelligence feeds, forensic reports, and dark web monitoring tools—each using different formats, timestamps, and classification methods. Unstructured sources, such as incident notes or malware reports, further complicate the process. Without standardized ingestion pipelines, integrating these varied inputs leads to fragmentation and reduced reliability.
Scalability and Performance Bottlenecks
Enterprise networks generate millions of security events daily, compounded by data from cloud workloads, API traffic, and endpoints. As the graph expands, multi-hop queries and deep historical lookups become computationally expensive, slowing query execution and impeding real-time analysis. Poorly optimized graphs struggle to keep pace with the demands of modern threat investigations.
Data Duplication and Entity Resolution
Multiple threat intelligence feeds often track the same indicators but with varying attributes, timestamps, or confidence levels. This redundancy results in duplicate nodes and conflicting relationships, which can distort threat correlations and generate false alerts. Without rigorous entity resolution processes, the graph risks pollution from inaccurate or misattributed threat mappings.
Stale Data and Maintaining Relevance
Threat intelligence can quickly become outdated; for example, an IP flagged as malicious today might be reclassified as legitimate tomorrow. Over reliance on stale data leads to false positives, while retaining excessive historical data bloats the graph and complicates queries. Striking a balance between preserving valuable historical context and ensuring real-time relevance is an ongoing challenge.
Standardization of Querying
Graph-based security analytics require specialized query languages—such as Cypher, Gremlin, or SPARQL—which may be unfamiliar to security teams used to SIEM-style keyword searches and predefined filters. This learning curve can hinder effective query execution, reducing the operational value of the knowledge graph and forcing analysts to rely on manual investigations.
Integration with Existing Infrastructure
Most organizations have established security workflows built around SIEM, SOAR, and XDR platforms. Integrating a knowledge graph into these existing systems can be problematic, particularly with legacy technologies that do not support graph-based analytics. API limitations, data export challenges, and vendor lock-in can isolate the graph from automated security workflows.
High Computational Costs
Graph queries—especially multi-hop analyses across millions of entities—demand substantial computational resources. As the graph scales, the cost of processing complex queries rises, and cloud-based environments may incur significant expenses for data storage, retrieval, and query execution. Without proper optimization, the financial burden of maintaining a large-scale knowledge graph can become unsustainable.
How PuppyGraph Can Help With Cybersecurity
PuppyGraph is engineered to overcome the common challenges in building and maintaining cybersecurity knowledge graphs, ensuring that security operations remain robust, agile, and efficient.

Zero Data Deduplication and Effective Entity Resolution
PuppyGraph minimizes data duplication by directly connecting to data lakes and relational stores, eliminating the need for ETL processes typically required by traditional graph databases. This direct integration maintains a consistent, unified schema across all data sources, preventing the creation of duplicate nodes and conflicting relationships. As a result, entity resolution is streamlined, leading to more accurate threat correlations and fewer false alerts.
Scalable Performance for Real-Time Analysis
Designed for petabyte-level data volumes, PuppyGraph decouples storage from computation. Its distributed, columnar architecture allows it to execute complex multi-hop queries across hundreds of millions of edges in seconds, thereby mitigating performance bottlenecks. This ensures that even as data scales, security teams can perform deep historical lookups and real-time threat analyses without delay.

Maintaining Data Relevance with Continuous Updates
PuppyGraph continuously ingests new threat intelligence, ensuring that outdated or stale data is promptly replaced. This dynamic updating mechanism strikes a balance between historical context and real-time relevance, thereby reducing false positives and keeping the graph current.
Versatile Querying and Graph Algorithm Support
PuppyGraph supports both Gremlin and OpenCypher, as well as a wide range of common graph algorithms. This flexibility enables security teams to execute complex graph queries using the query language that best fits their workflow while leveraging robust algorithms for tasks such as pattern matching, clustering, and centrality analysis.

Conclusion
Cybersecurity knowledge graphs provide a fresh perspective on threat detection by transforming fragmented data into interconnected and actionable insights. They enable security teams to uncover complex attack patterns and respond to threats with greater speed and precision. Building these graphs presents challenges in data ingestion, scalability, and integration, yet overcoming these obstacles is key to a more proactive defense strategy.
For organizations seeking to modernize their cybersecurity operations, embracing knowledge graphs offers a critical path toward a more agile and effective security posture. Visit our Cybersecurity page to learn more about how PuppyGraph can transform your threat intelligence and secure your digital environment.
If you want to see for yourself how PuppyGraph can help turn your security data into real-time actionable intelligence, download the forever free PuppyGraph Developer Edition, or book a free demo today with our graph expert team.
Matt is a developer at heart with a passion for data, software architecture, and writing technical content. In the past, Matt worked at some of the largest finance and insurance companies in Canada before pivoting to working for fast-growing startups.

Matt is a developer at heart with a passion for data, software architecture, and writing technical content. In the past, Matt worked at some of the largest finance and insurance companies in Canada before pivoting to working for fast-growing startups.


Get started with PuppyGraph!


Developer Edition
- Forever free
- Single noded
- Designed for proving your ideas
- Available via Docker install
Enterprise Edition
- 30-day free trial with full features
- Everything in developer edition & enterprise features
- Designed for production
- Available via AWS AMI & Docker install